Tomorrow is Earth Day and we want you to take some time and go through some images – an image is worth a thousand words.
For every action, there is an equal and opposite reaction – we are not trying to make a statement or argument, nether to proof climate change or global warming. We just challenge you to think about the chain reaction we trigger on our everyday’s actions.
Deforestation
2000 – MODIS on NASA’s Terra satellite, images of Amazon deforestation in Rondônia (Brazil). (source: NASA)2010 – MODIS on NASA’s Terra satellite, images of Amazon deforestation in Rondônia (Brazil). (source: NASA)
Arctic Sea Ice Age
A still image of the annual minimum sea ice age in 2016 with the graph overlay. The green memory bars portray the maximum annual value for each age range seen since January 1, 1984 on the day of the annual minimum.
1984 – A still image of the annual minimum sea ice age in 1984 with the graph overlay. (source: NASA) 2016 – A still image of the annual minimum sea ice age in 2016 with the graph overlay. The green memory bars portray the maximum annual value for each age range seen since January 1, 1984 on the day of the annual minimum. (source: NASA)
Global Temperature
Global Temperature Anomalies averaged from 2009 to 2013 in Robinson projection.
1950 – This color-coded map in Robinson projection displays a progression of changing global surface temperatures anomalies. Higher than normal temperatures are shown in red and lower then normal temperatures are shown in blue. (source: NASA)2013 – Global Temperature Anomalies averaged from 2009 to 2013 in Robinson projection. (source: NASA)
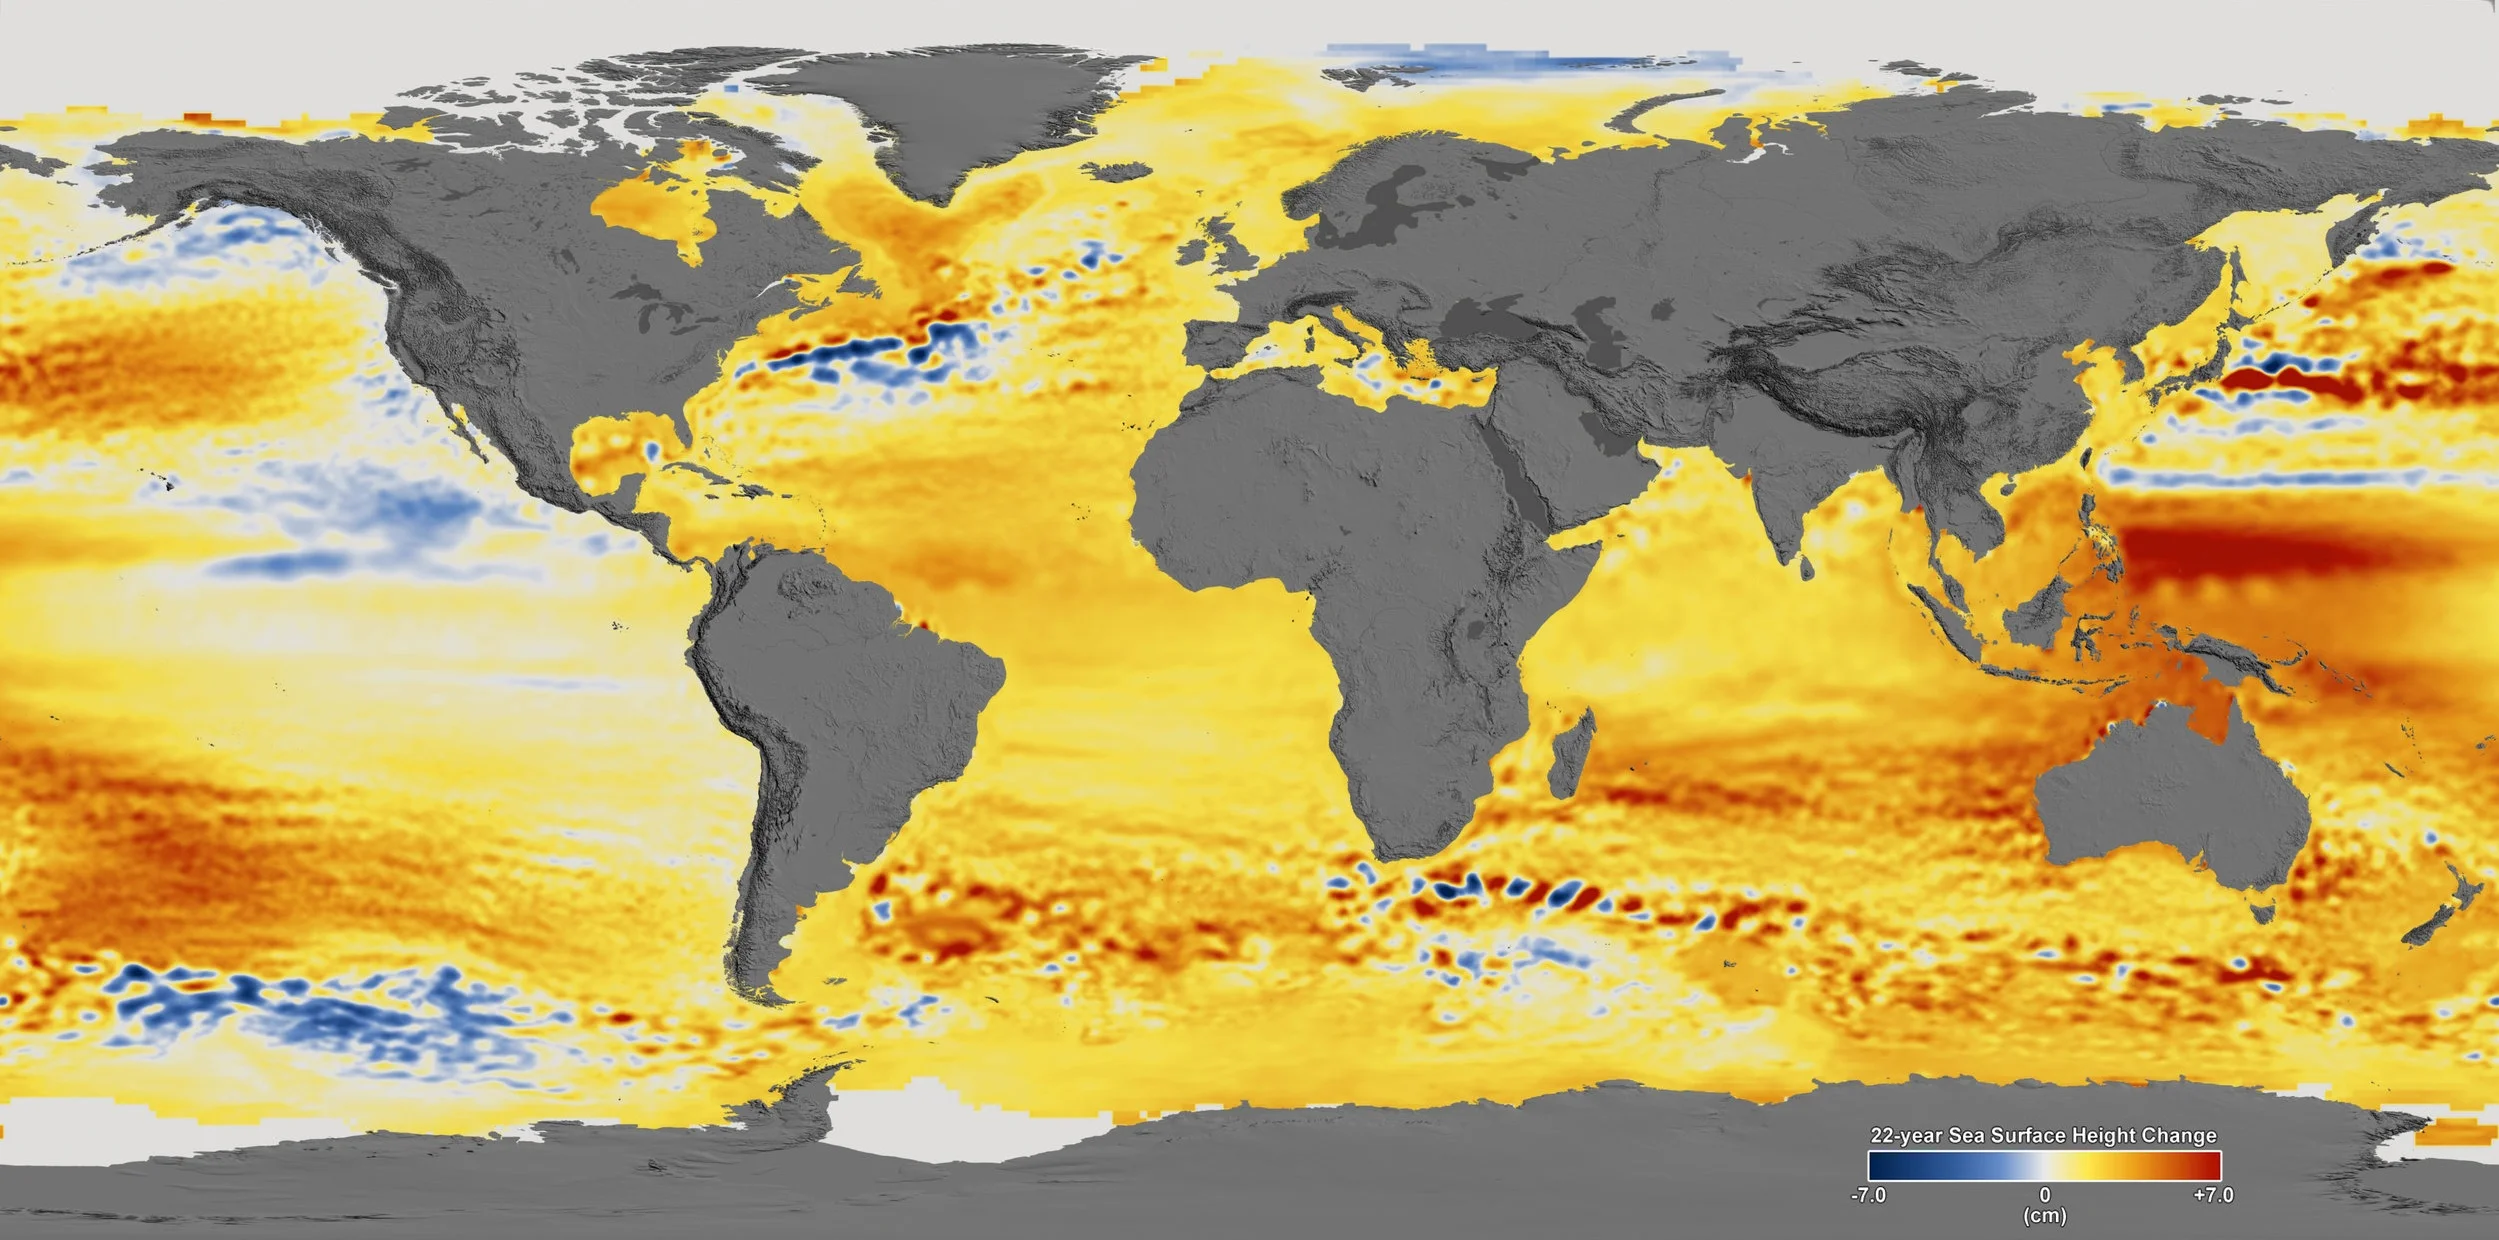
22-year Sea Level Rise
This visualization shows total sea level change between 1992 and 2014, based on data collected from the TOPEX/Poseidon, Jason-1, and Jason-2 satellites. The color range for this visualization is -7 cm to +7 cm. This particular range was chosen to highlight variations in sea level change. (source: NASA)
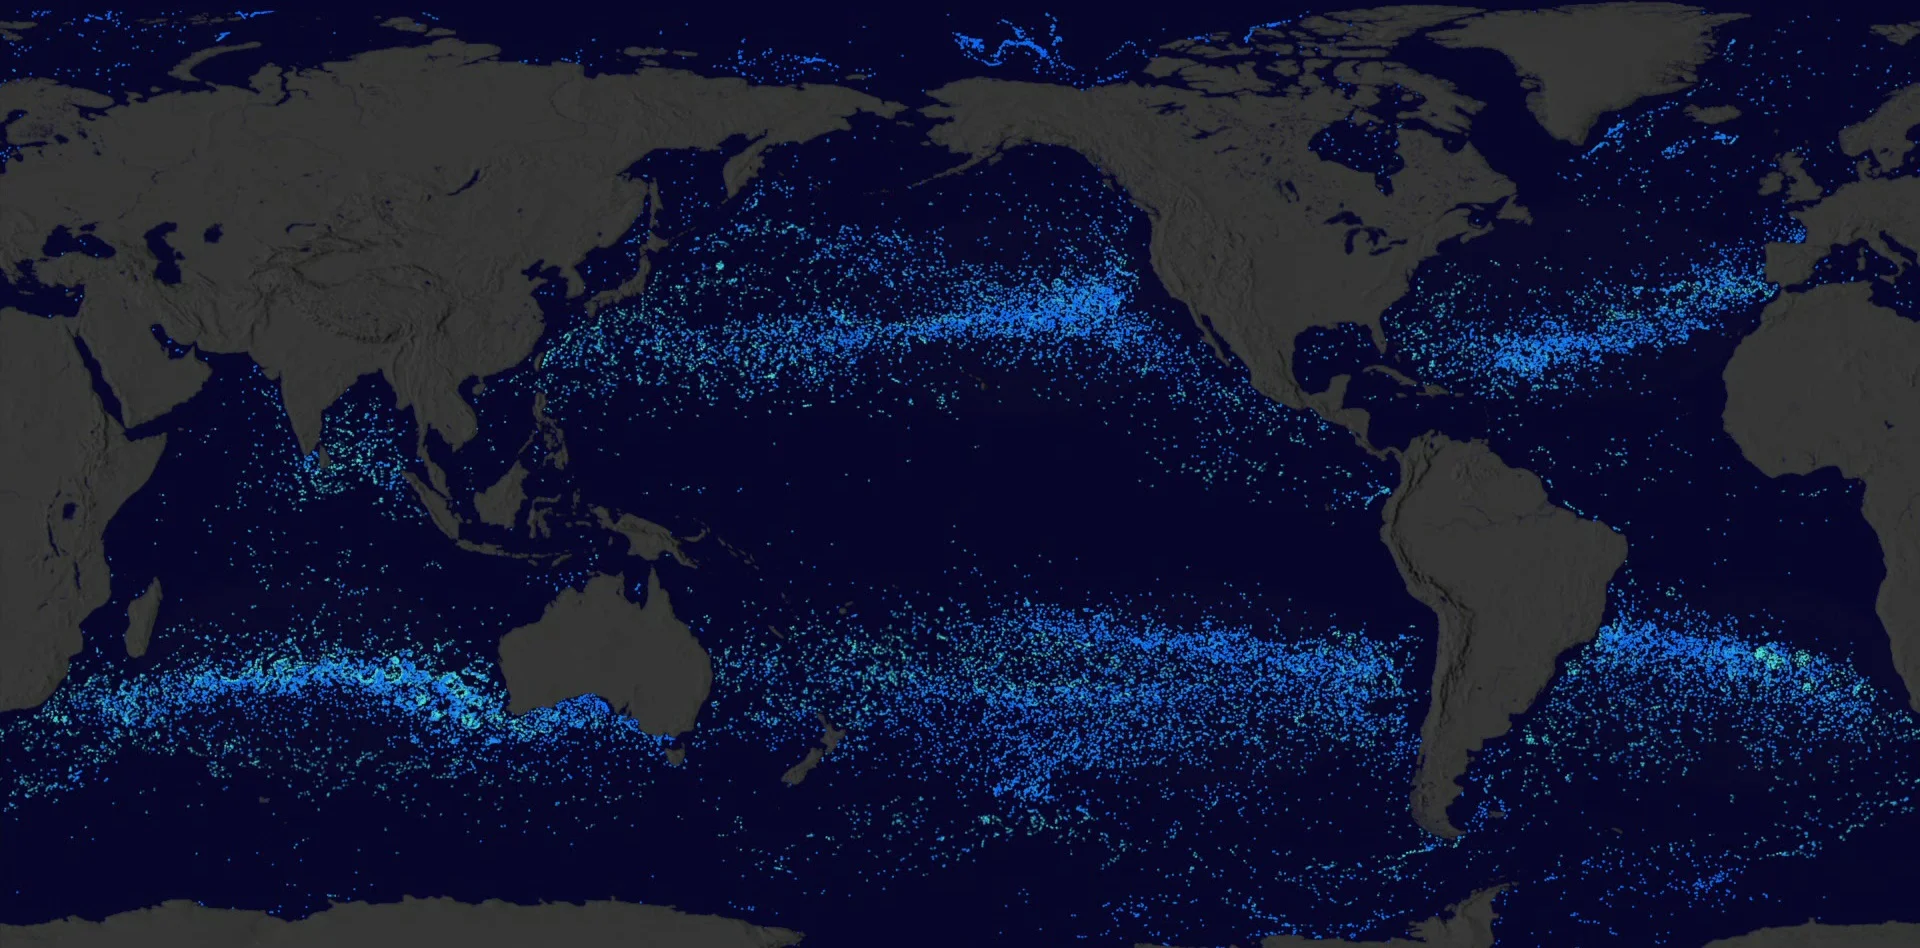
Plastic, Plastic, Where is All Our Plastic?
Plastic, Plastic, Where is All Our Plastic? – Boys released over the last 35 year showing the 5 major ocean garbage patches. (source: NASA)
To provide the best experiences, we use technologies like cookies to store and/or access device information. Consenting to these technologies will allow us to process data such as browsing behavior or unique IDs on this site. Not consenting or withdrawing consent, may adversely affect certain features and functions.
Functional
Always active
The technical storage or access is strictly necessary for the legitimate purpose of enabling the use of a specific service explicitly requested by the subscriber or user, or for the sole purpose of carrying out the transmission of a communication over an electronic communications network.
Preferences
The technical storage or access is necessary for the legitimate purpose of storing preferences that are not requested by the subscriber or user.
Statistics
The technical storage or access that is used exclusively for statistical purposes.The technical storage or access that is used exclusively for anonymous statistical purposes. Without a subpoena, voluntary compliance on the part of your Internet Service Provider, or additional records from a third party, information stored or retrieved for this purpose alone cannot usually be used to identify you.
Marketing
The technical storage or access is required to create user profiles to send advertising, or to track the user on a website or across several websites for similar marketing purposes.